
This guide shows how the new APX dashboards turn inspection, investigation, incident, personnel, and response-time data into quick, actionable insights—highlighting problem areas (common deficiencies, re-inspection gaps), performance (inspection counts, personnel responses), and outcomes (fire loss, ignition sources). It explains which views and filters to use to monitor trends, spot outstanding follow-ups, compare response times to benchmarks, and produce shareable reports for decision-making.
1. The Overview page allows users to easily access the available dashboards for different modules.
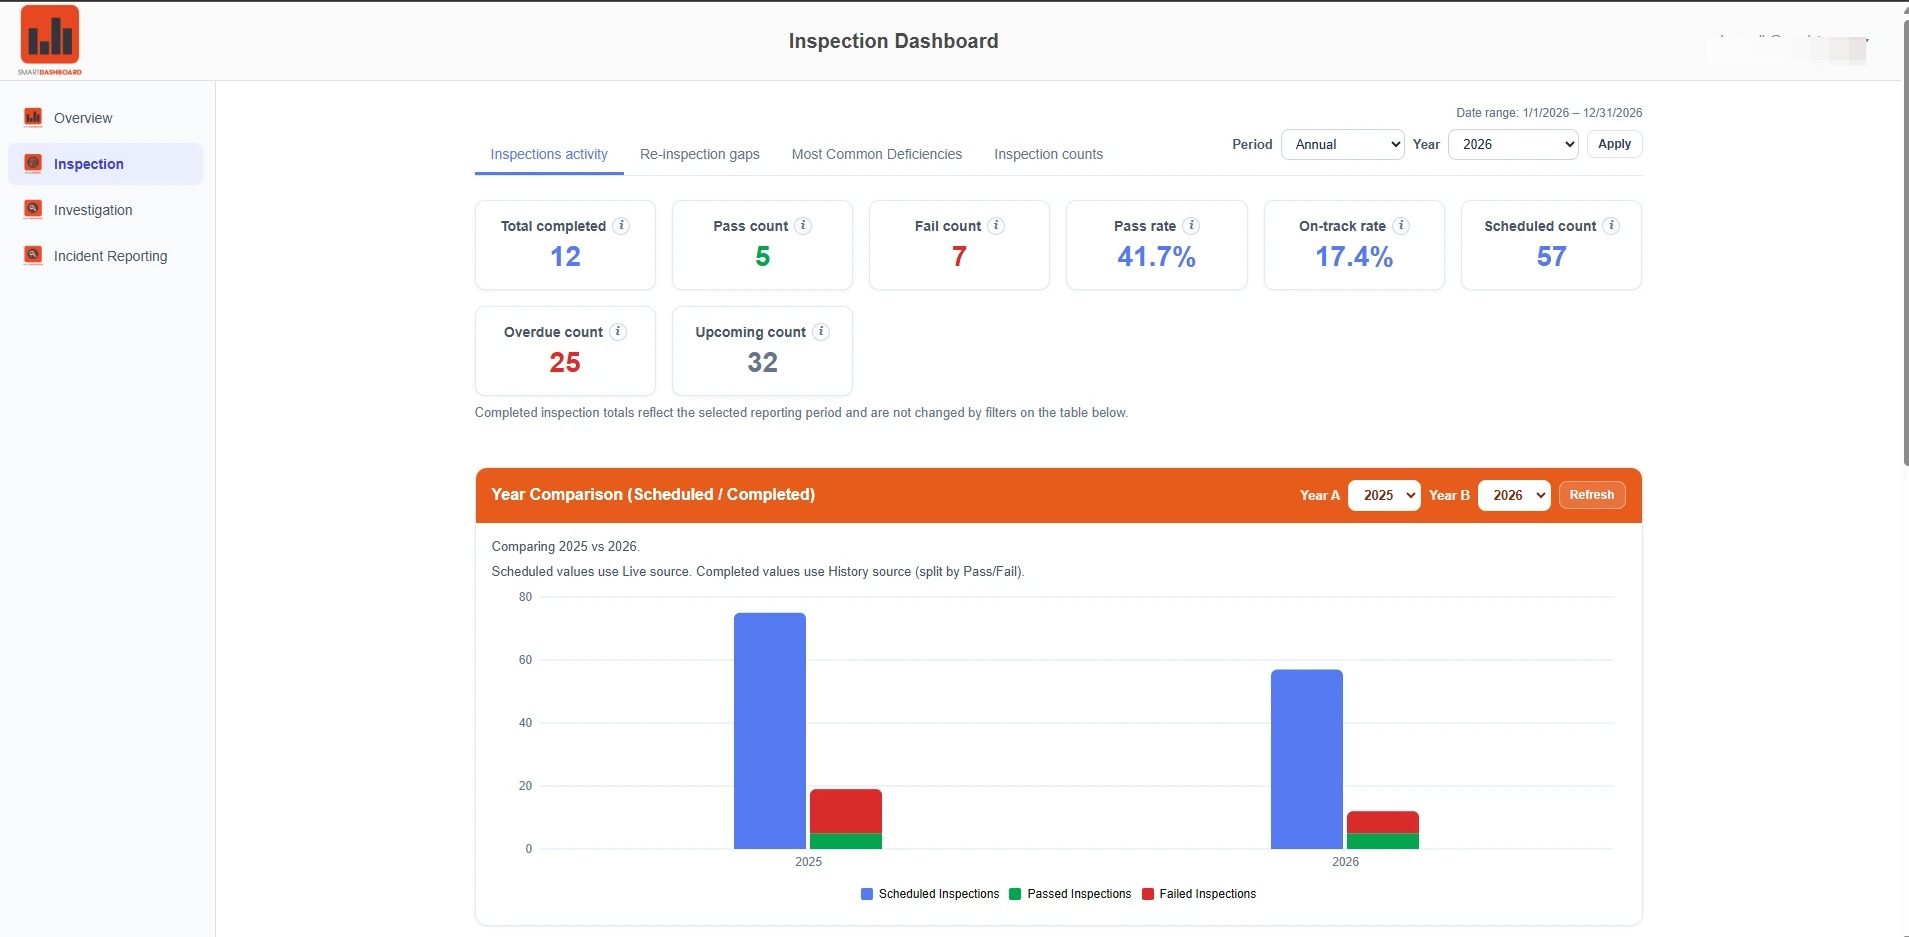
2. The Inspection Dashboard contains several dashboards, including Inspection Activity. This view lets users filter by date range, and then see a high level summary of inspections activity in tiles, a bar chart, and in tabular format.
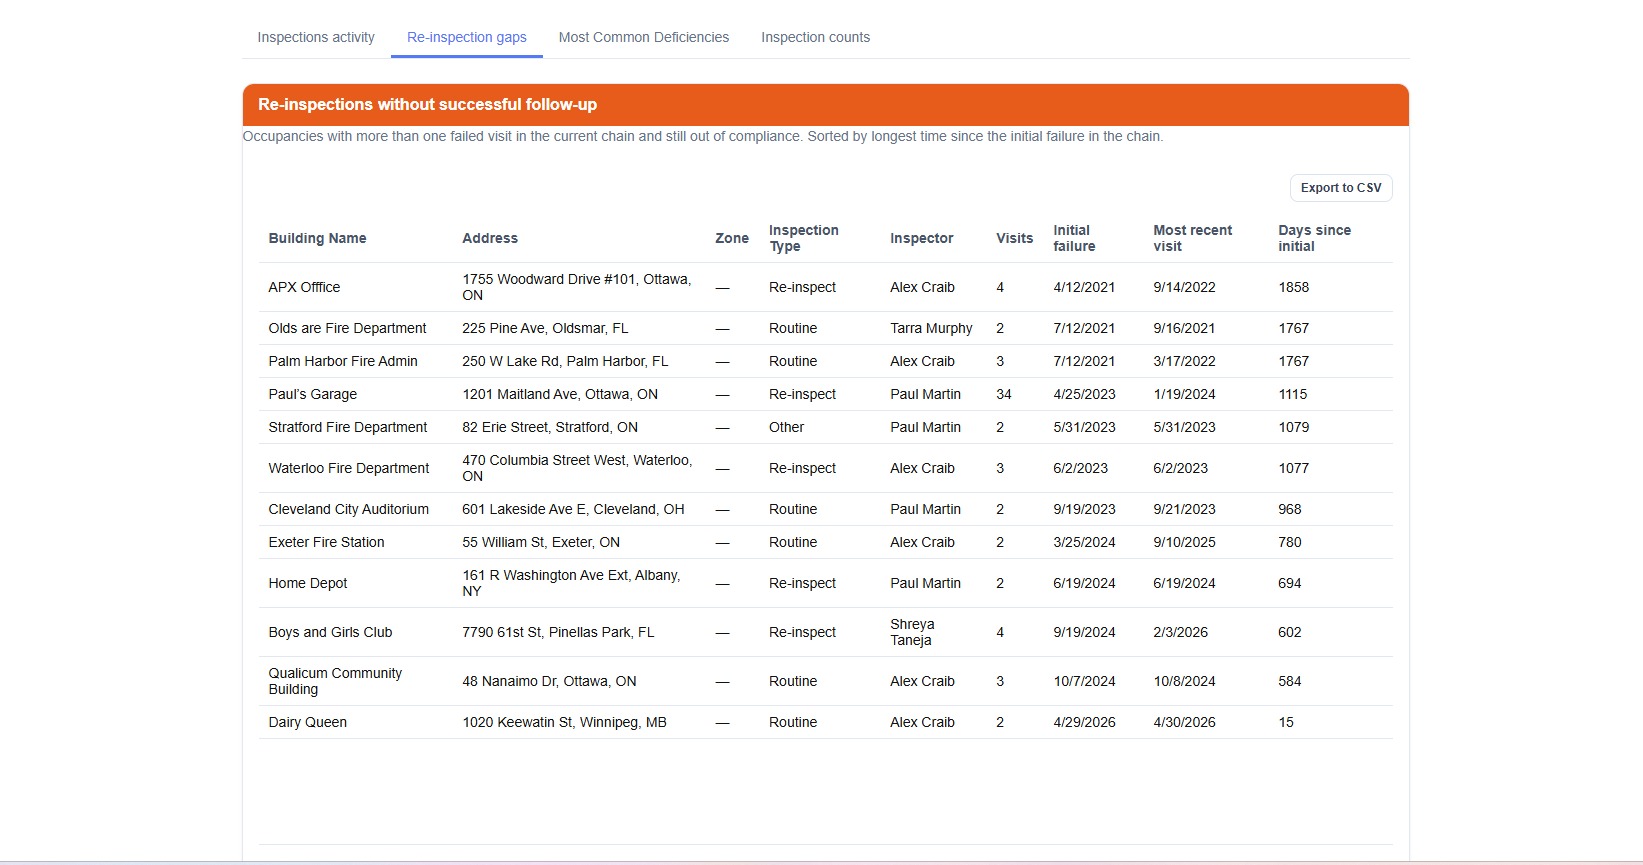
3. The Re-inspection gaps view allows users to see inspections in the current inspections cycle that have failed their initial inspection with no subsequent follow-up. You can see the date of initial inspection, the number of subsequent visits, and the days since the initial inspection.
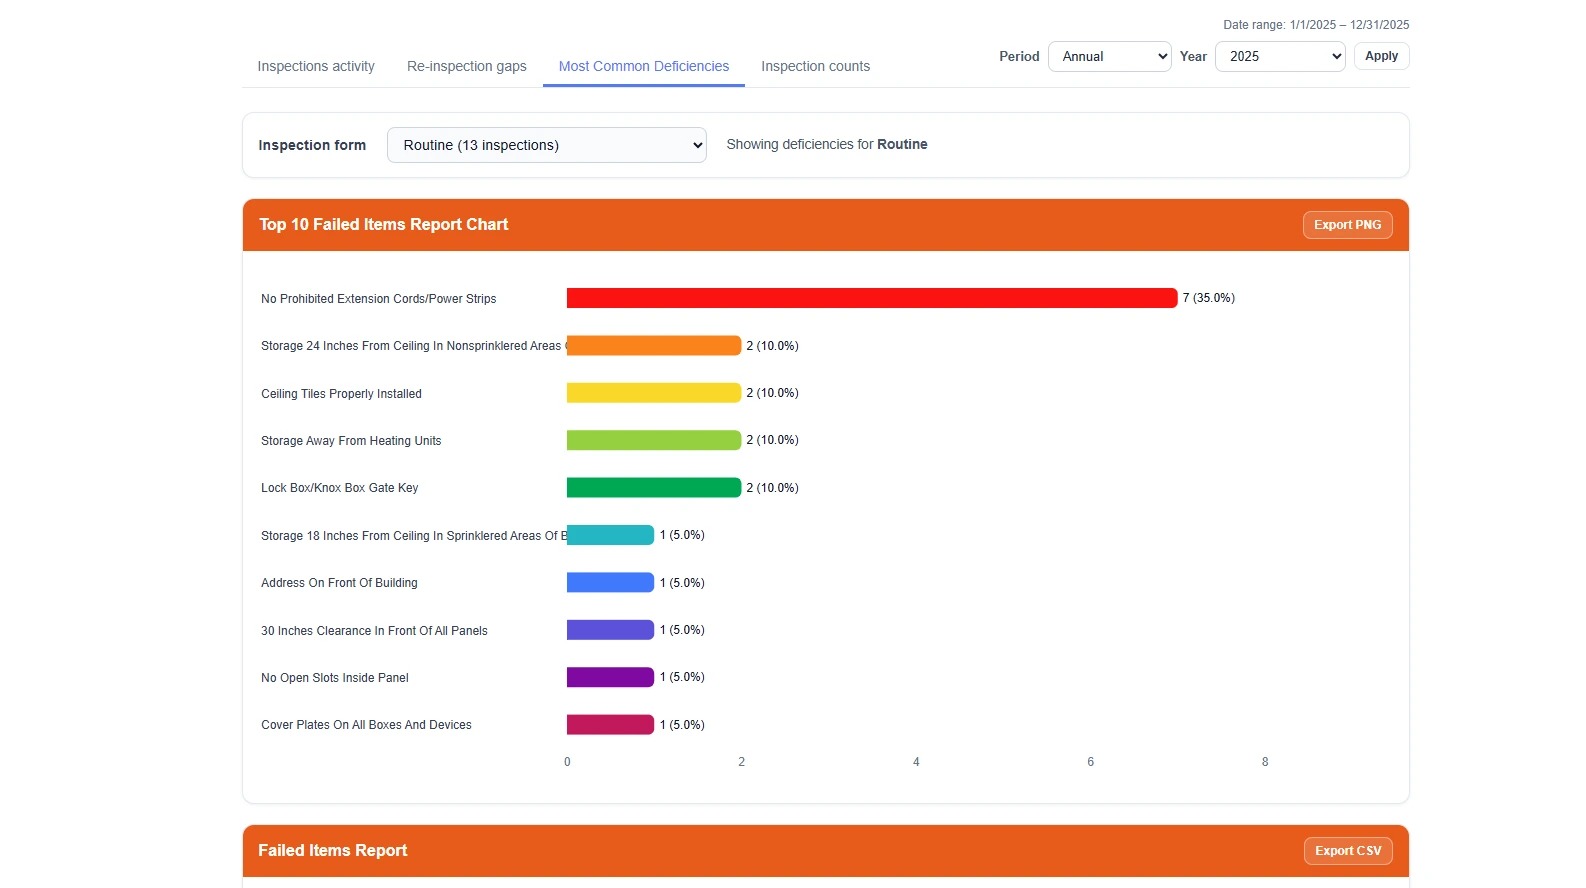
4. The Most Common Deficiencies view lets users pick an inspection form and then view the most common deficiencies over a given time range. A bar chart shows the 10 most frequent deficiencies, while a table shows the full dataset of violations.
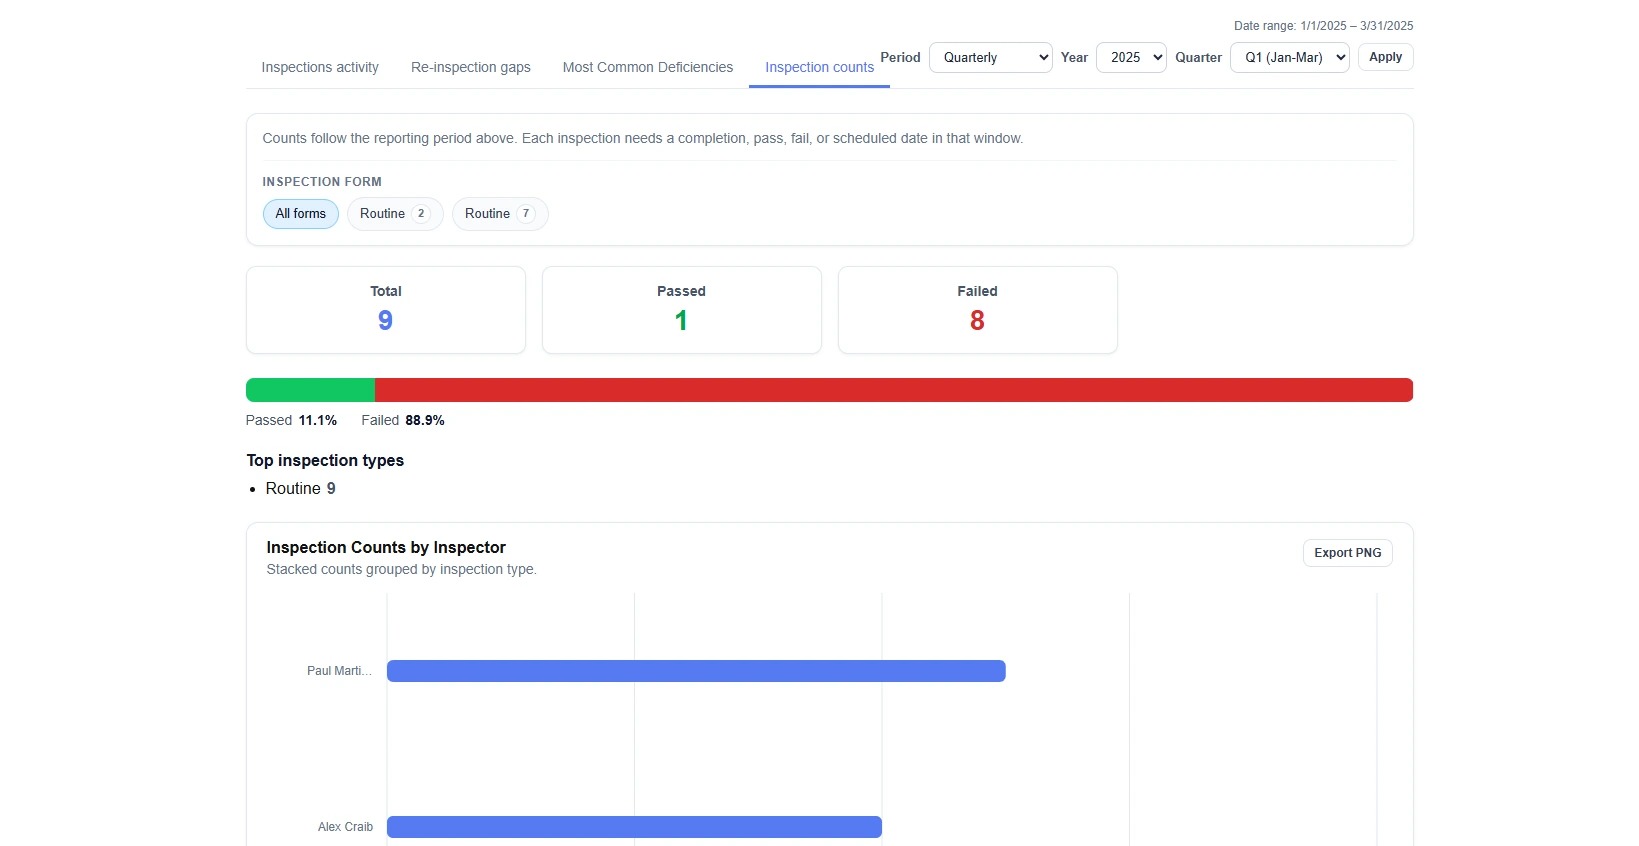
5. The Inspection counts view shows the number of inspections completed over a given range, broken down by type and by inspector.
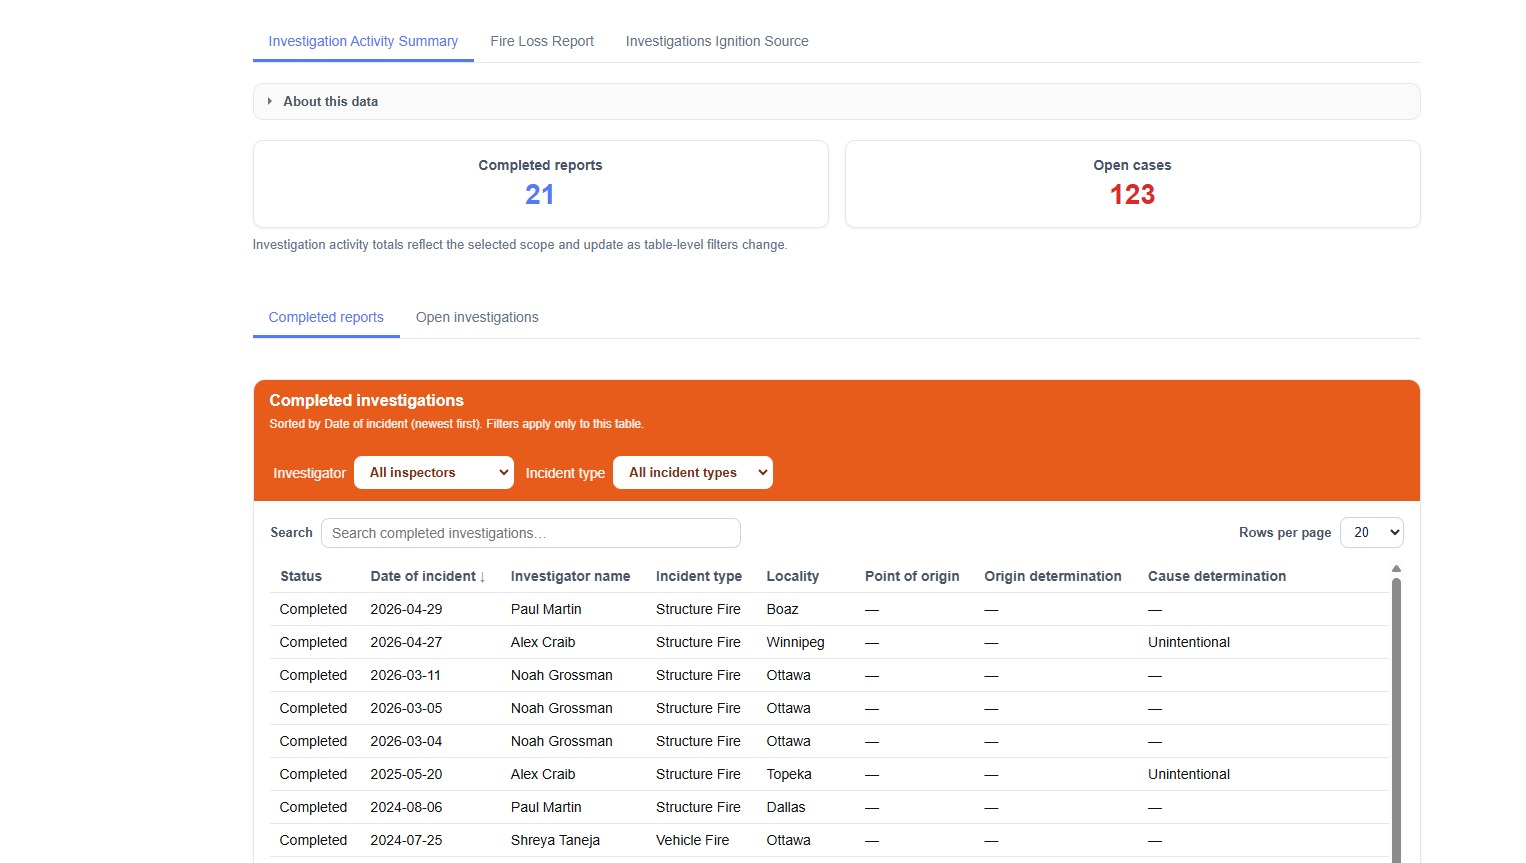
6. Within the Investigations dashboard, the Investigation Activity Summary view lets users see the number of completed vs open cases, and provides a table filterable by user and by incident type.
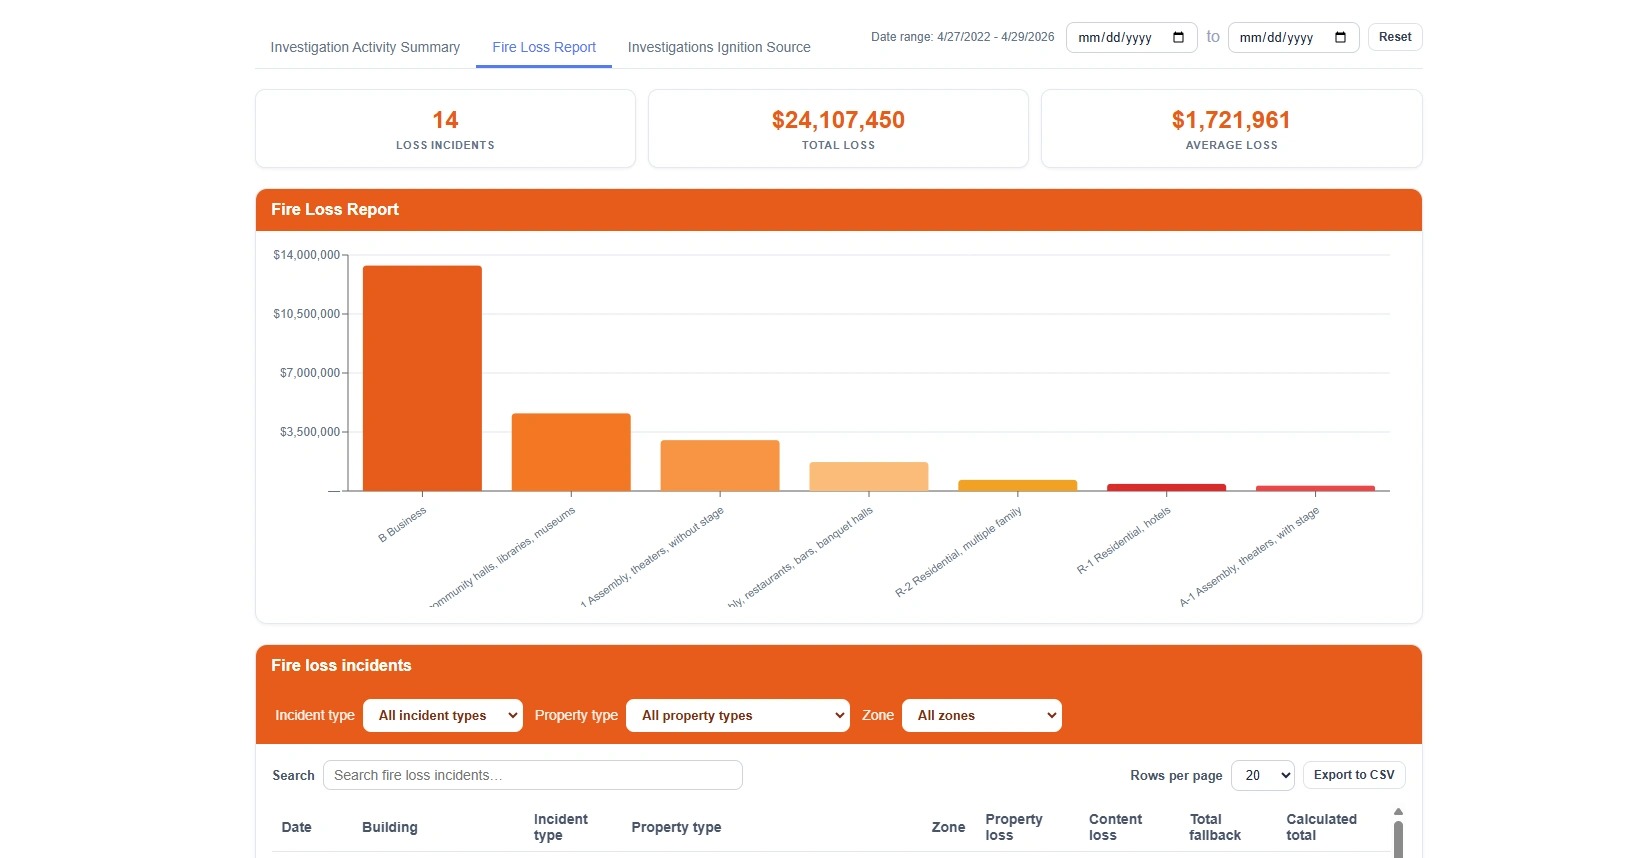
7. The Fire Loss Report view lets users see a high-level report on financial losses attributed to investigated incidents.
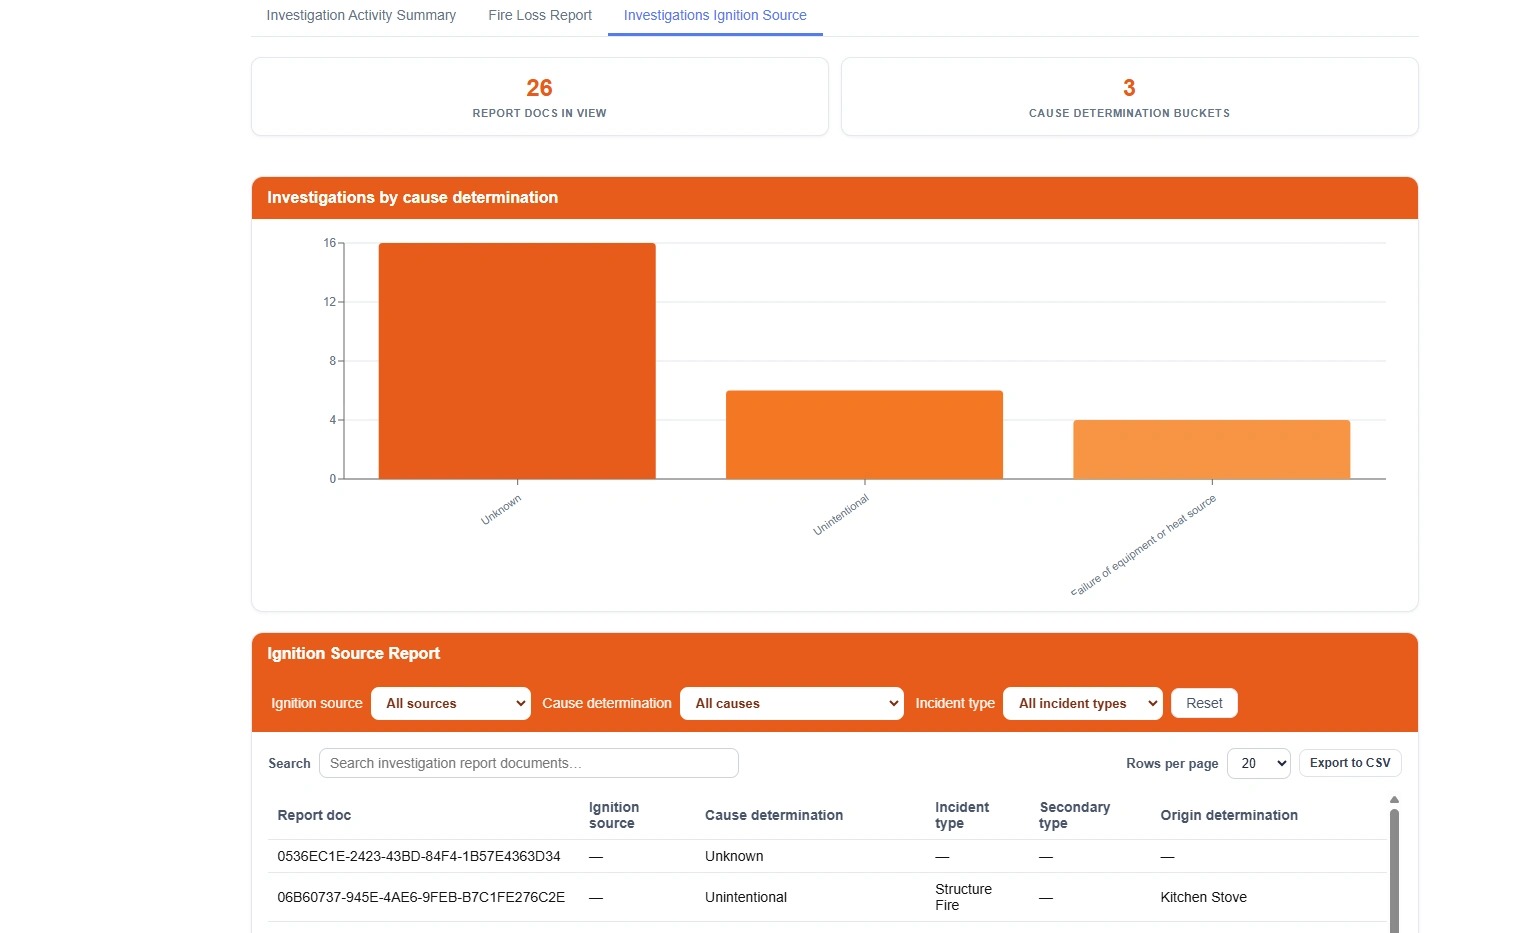
8. The Investigations Ignition Source view lets users see a report on the different cause determinations, ignition sources identified, and origin determinations made as part of investigated incidents.
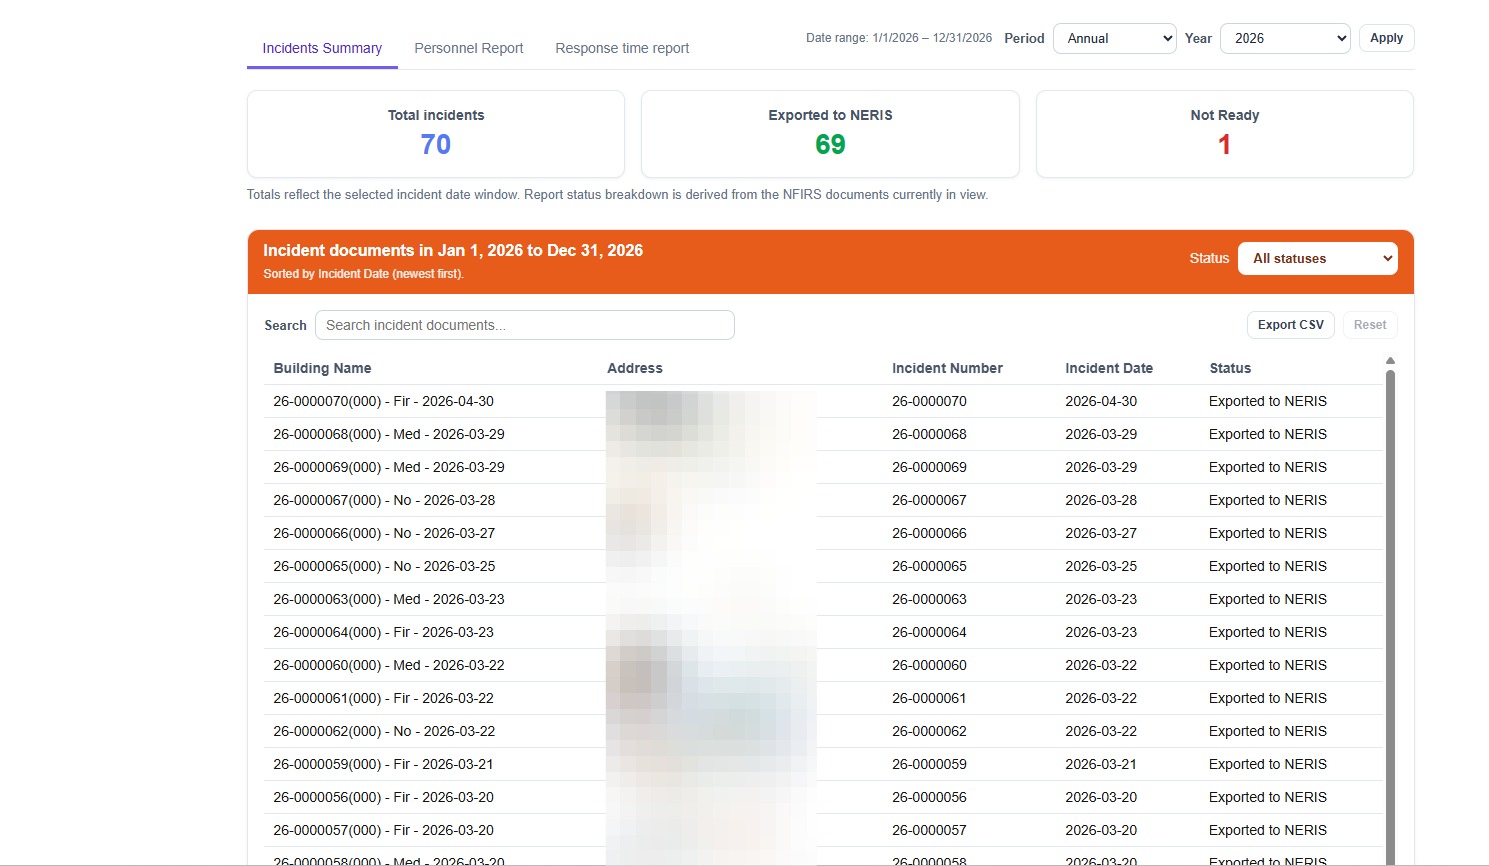
9. The Incident Reporting Dashboard allows users to run several different incident response related reports. The Incidents Summary view lets users see total incidents over a given range, the number exported to NERIS (if applicable), and those still needing to be completed.
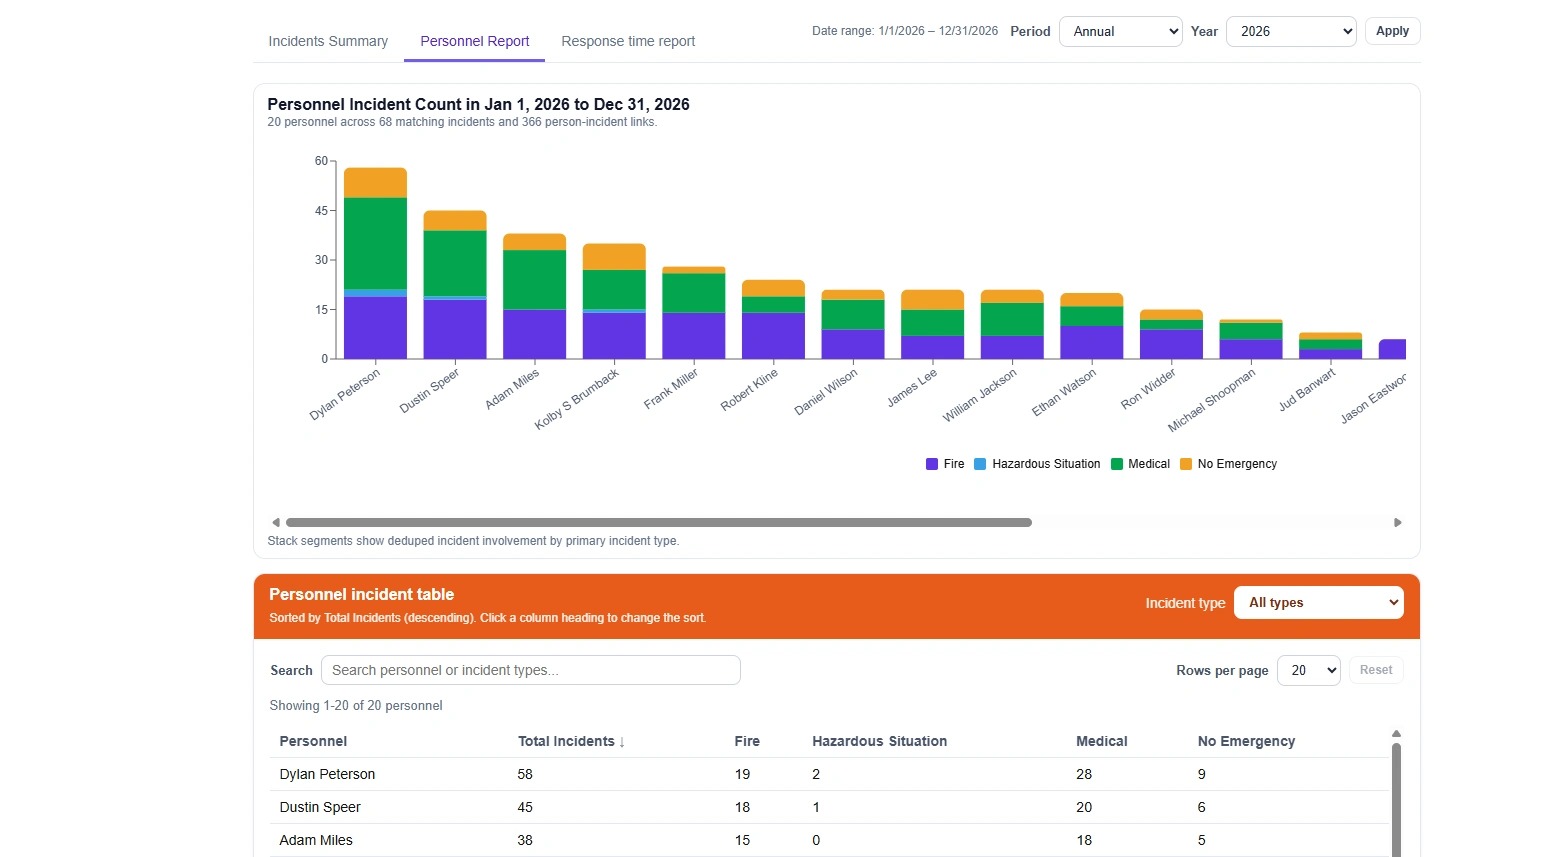
10. The Personnel Report view lets users see the number of incidents responded to over a given range, by personnel and broken down by incident type. The information is provided in a bar chart and a table.
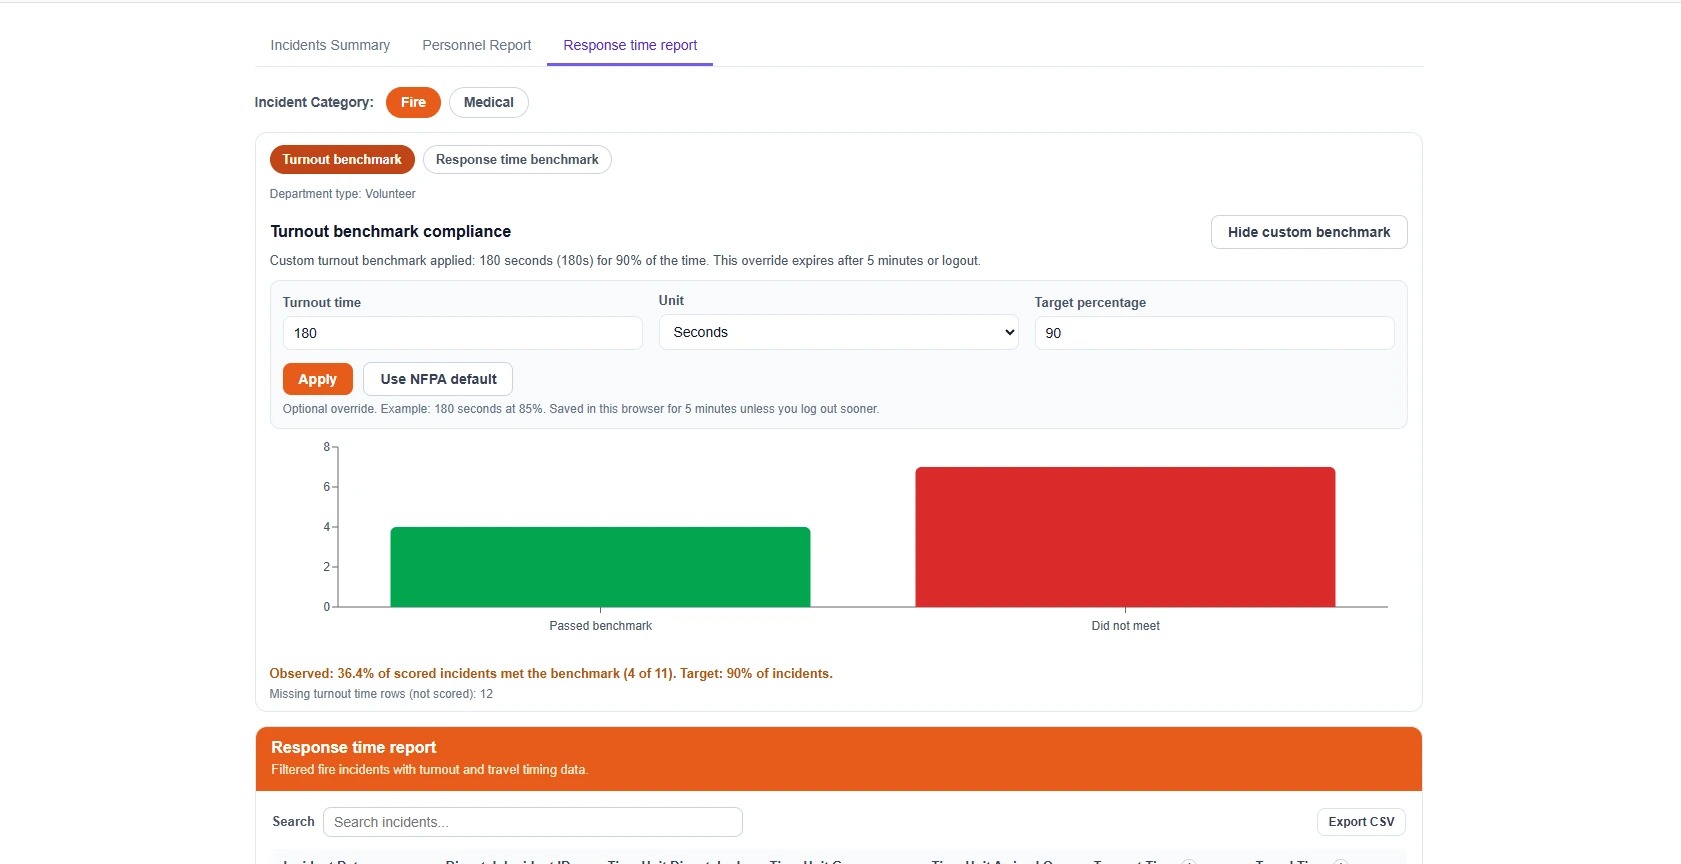
11. The Response time report view lets users view both Fire calls and Medicals calls and see how their response times (turnout and total response time) compare to either NFPA benchmarks, or custom benchmarks.
Comments
0 comments
Please sign in to leave a comment.